By Alan Coleman on 6 May 2020
The Weekly Online Economy Report - May 4th
As Featured In


.jpg)

.jpg)
We’ve analysed over 57 million website sessions and over €213 million euro in online revenue over the past 13 weeks (Mon-Sun), to compile a weekly report covering the movements in the online economy during the Covid19 crisis.
In this week’s report, we’ll have the opportunity to take a month on month on month view on the online economy using February as our base and monitoring how consumer spend moved in March and April. We also examine the Google and Amazon quarterly reports.
Here are our monthly figures:
Retail

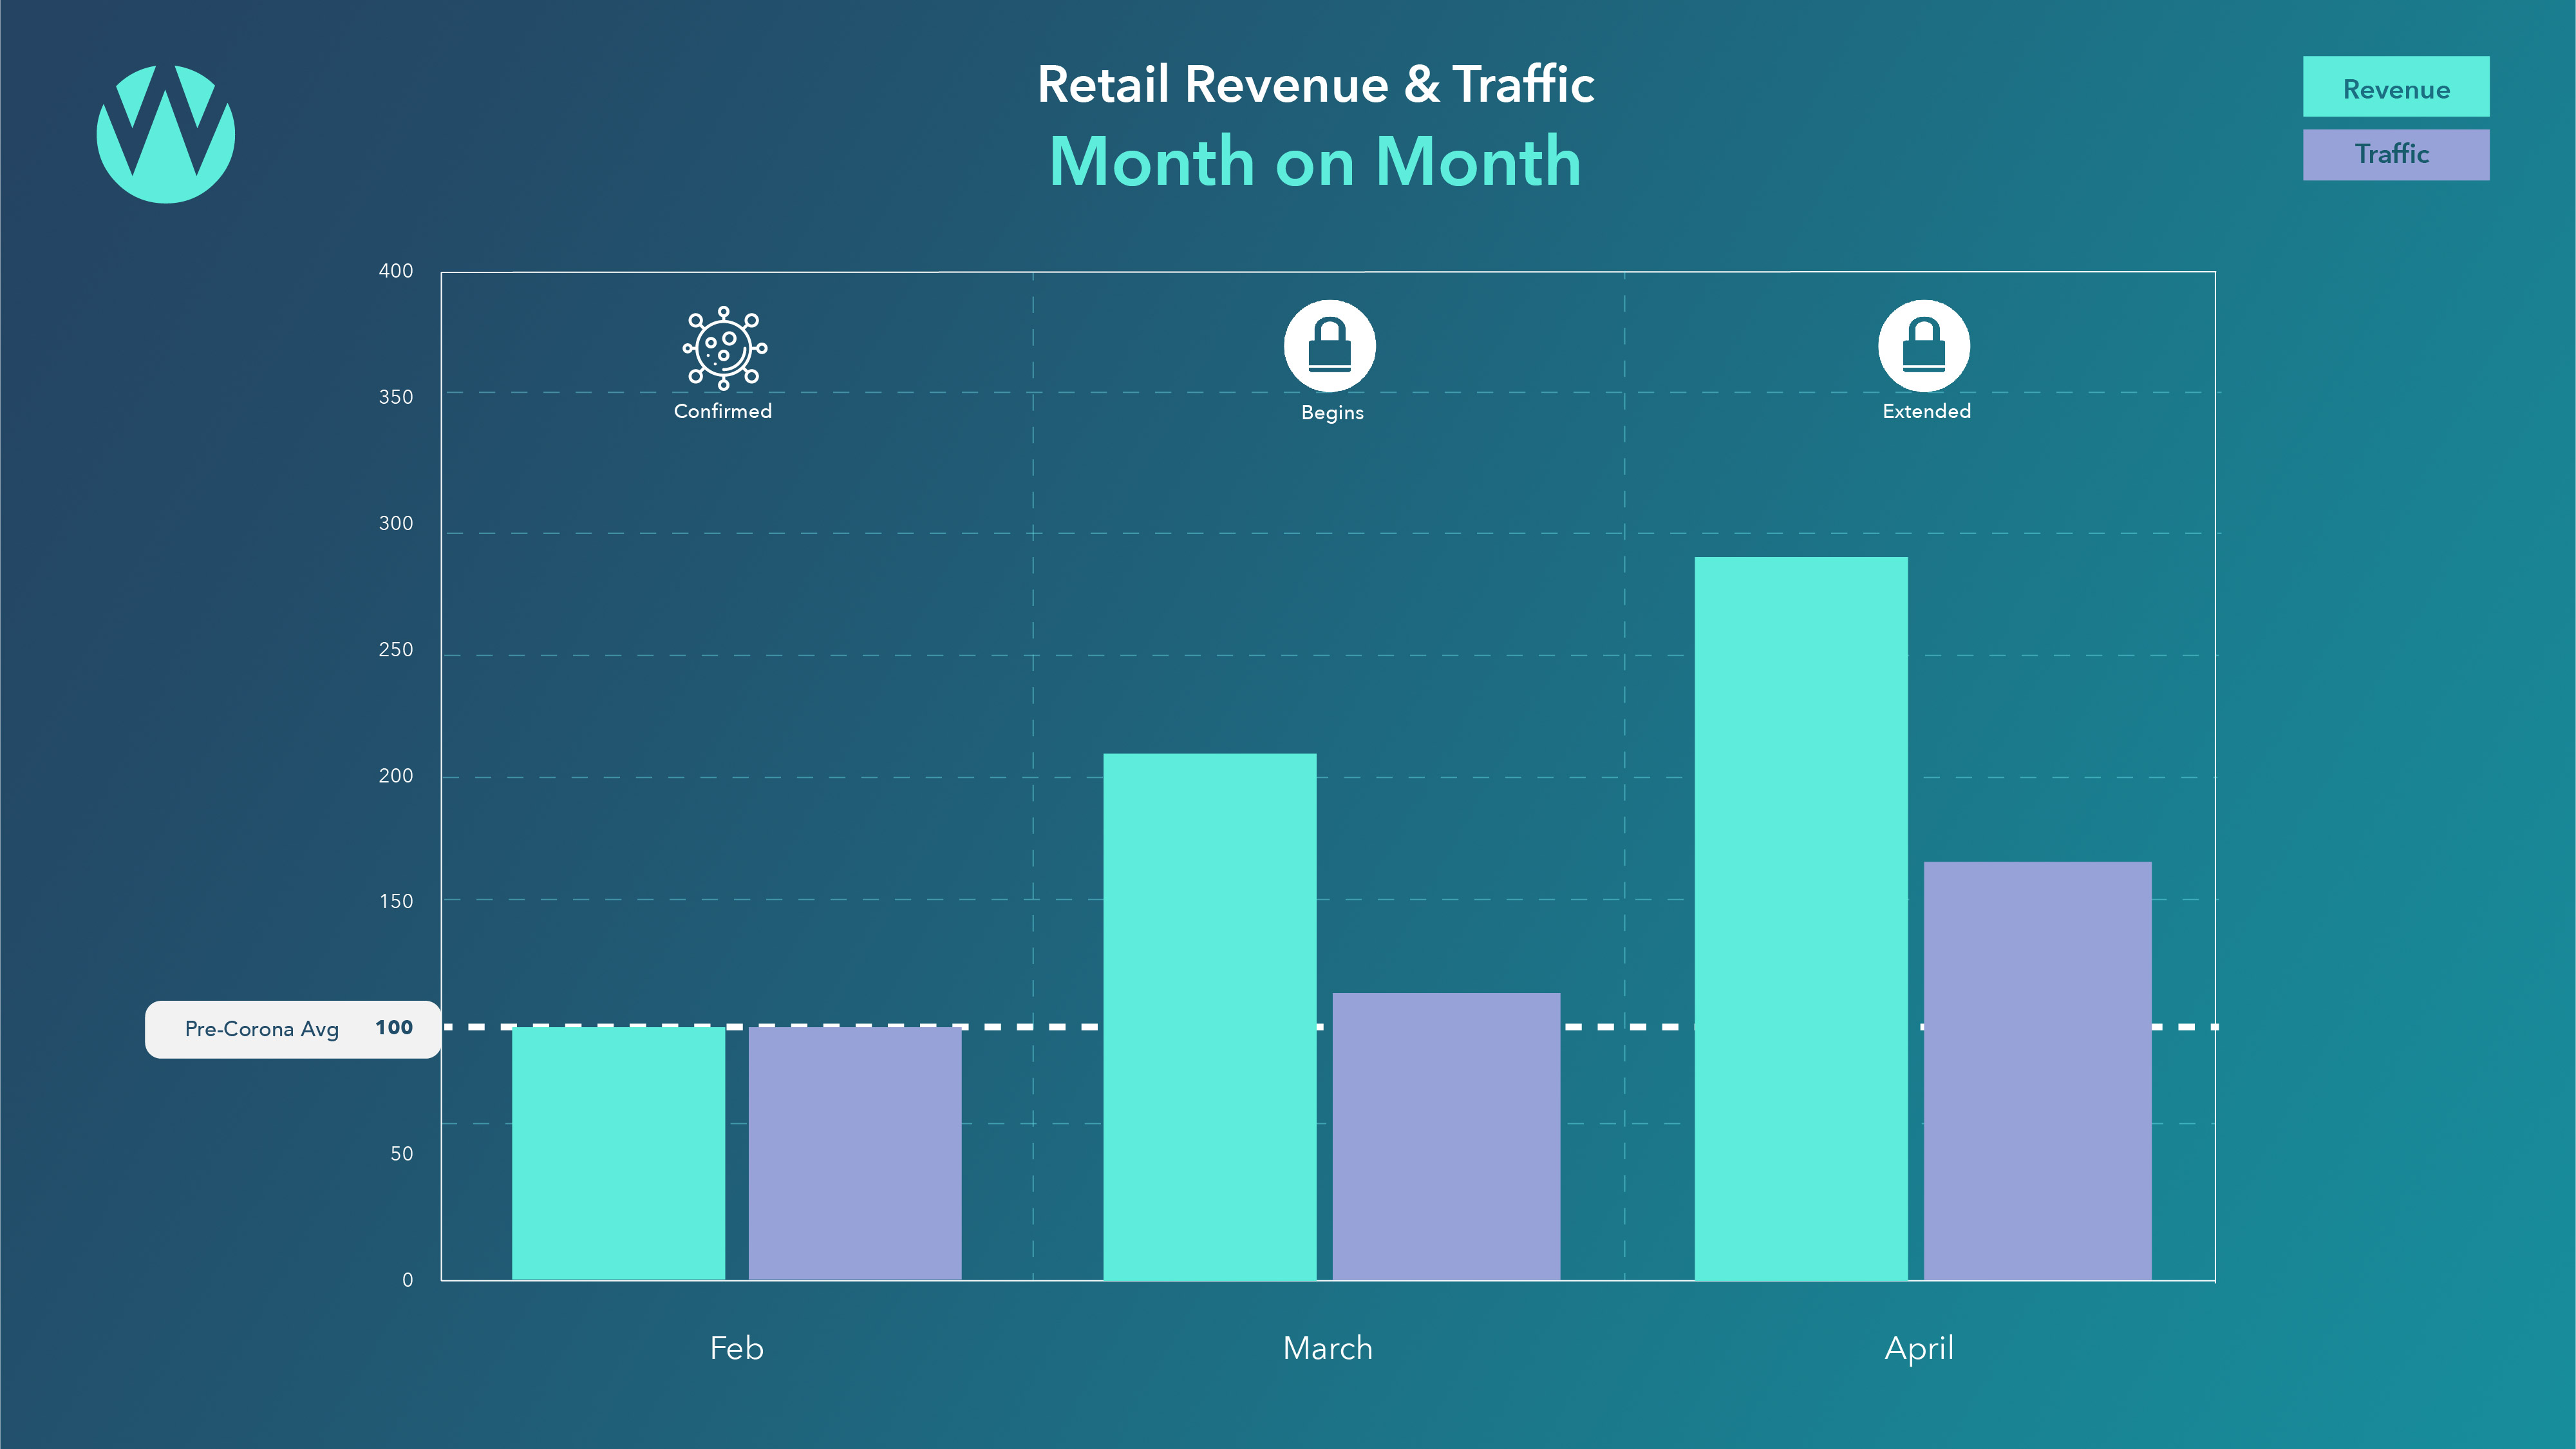
April’s online retail revenue was almost treble that of pre-covid levels. With e-commerce estimated to be 16% of overall retail, multichannel retailers have still lost more than half of their business.
March and April saw online retail traffic climb 8% and 60% respectively. The movements in online revenue have been more pronounced, rising 109% in March and then up 187% in April from February's base.
Average revenue per click has increased by a momentous 80% for online retailers from February to April. This combined with falling cost per clicks has widened online profit margins for retailers.Scant reward to multi-channel retailers given the overall loss of business.
The Enterprise Ireland COVID-19 Online Retail Scheme announcement brings welcomed news to the industry. The support covers up to a maximum of 80% of eligible costs on projects from €12,000 up to €50,000.
Find out about Wolfgang’s Covid-10 Online Retail Scheme Packages designed to help get your retail operations back on track, including details on how you can apply. Applications open presently and close after 4 weeks.
Travel

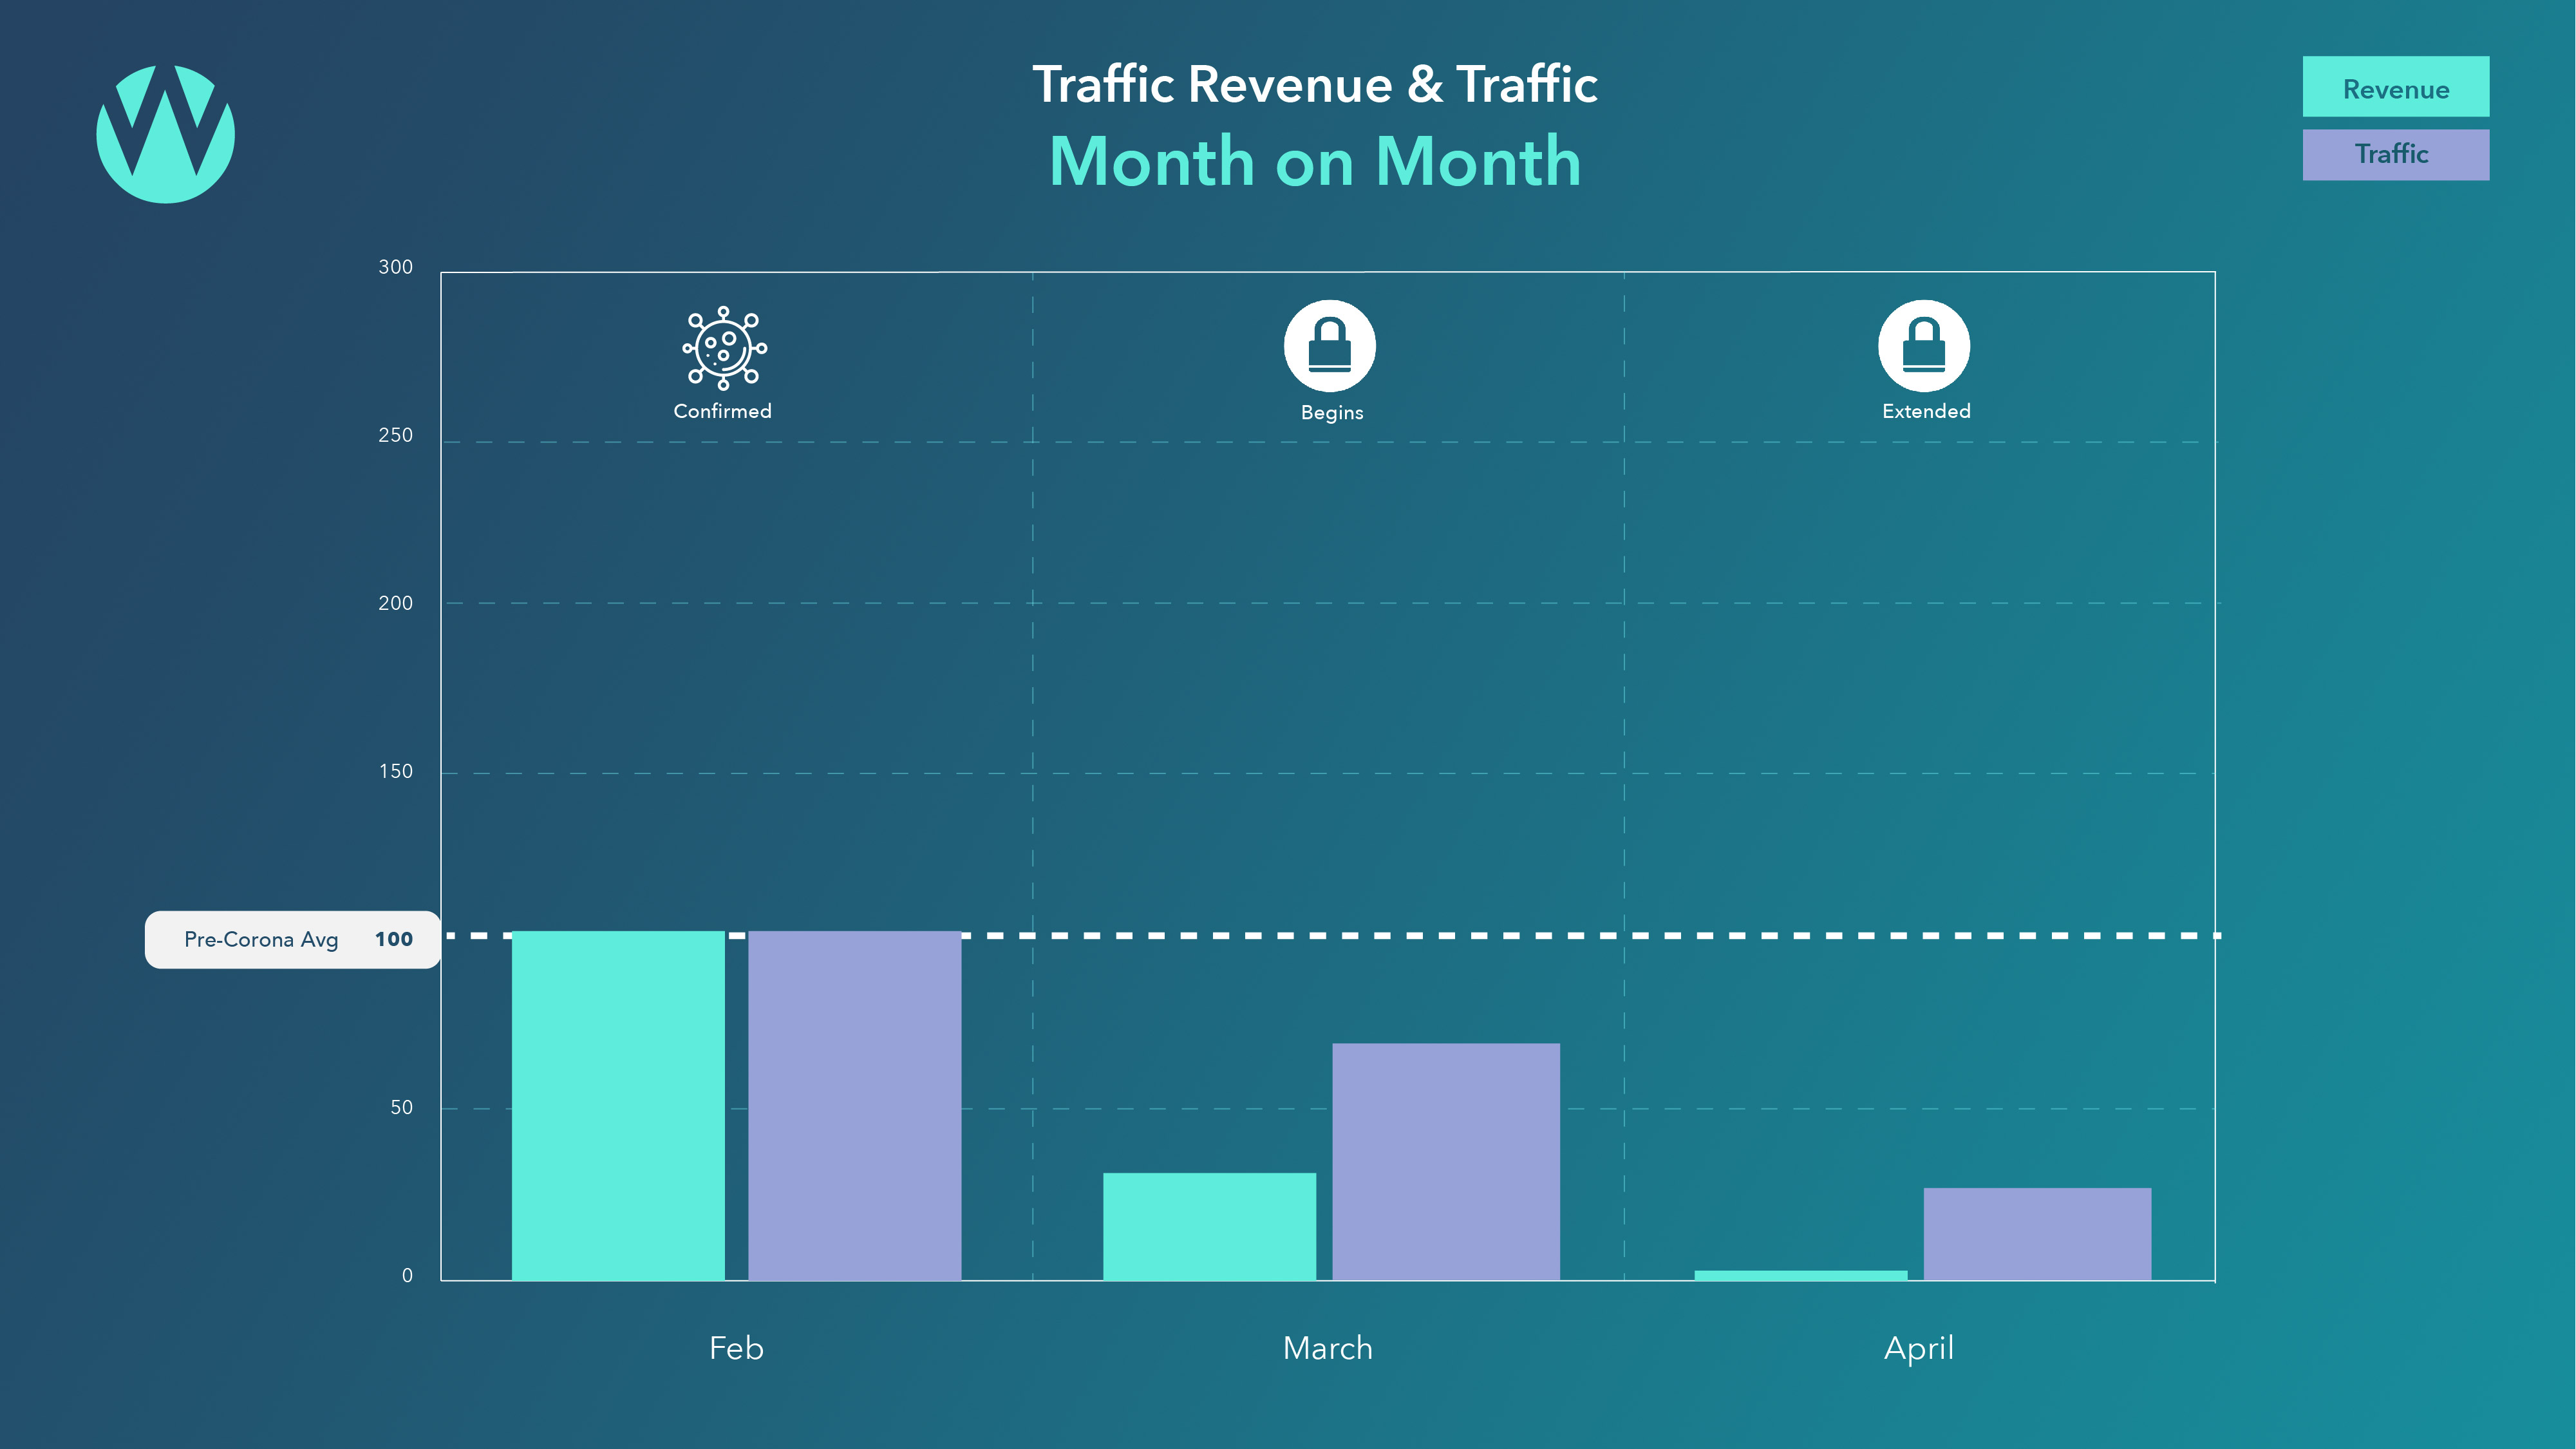
April’s Travel revenue figure was 3% of pre-covid levels. The travel industry is in a covid induced coma.Traffic reduced by 34% in March and 76% in April on pre-corona levels. Revenue fell 68% in March and down to 97% in April.
We’ll analyse monthly movements in Cost Per Click and Return on AdSpend in next week’s On The Money Report.
We cover the Tech Giants Q1 reports in our monthly Battle of the Internet Giants post.
About the data
The dataset is dynamic, after we publish figures Google Analytics may continue to attribute revenue to previous weeks. In addition we might add and we might lose participants over time.This may lead to slight variances in the figures as time passes.


