By Alan Coleman on 27 Apr 2020
The Weekly Online Economy Report - April 27th
As Featured In


.jpg)

.jpg)
We’ve analysed over 53 million website sessions and over €192 million euro in online revenue over the past 12 weeks (Mon-Sun), to compile a weekly report covering the previous week's movements in the online economy during the Covid19 crisis.
The first four weeks fell in February and were before the Covid19 crisis took hold. The next 8 weeks are from March into April when the crisis started to escalate. When we say 'last week' we are referring to Monday 20th - Sunday 26th of April.
In next week’s report, we’ll have the opportunity to take a monthly view on the figures as well as possibly having some insights on traffic and revenue from the Google and Amazon quarterly figures.Here are last weeks figures.
Retail

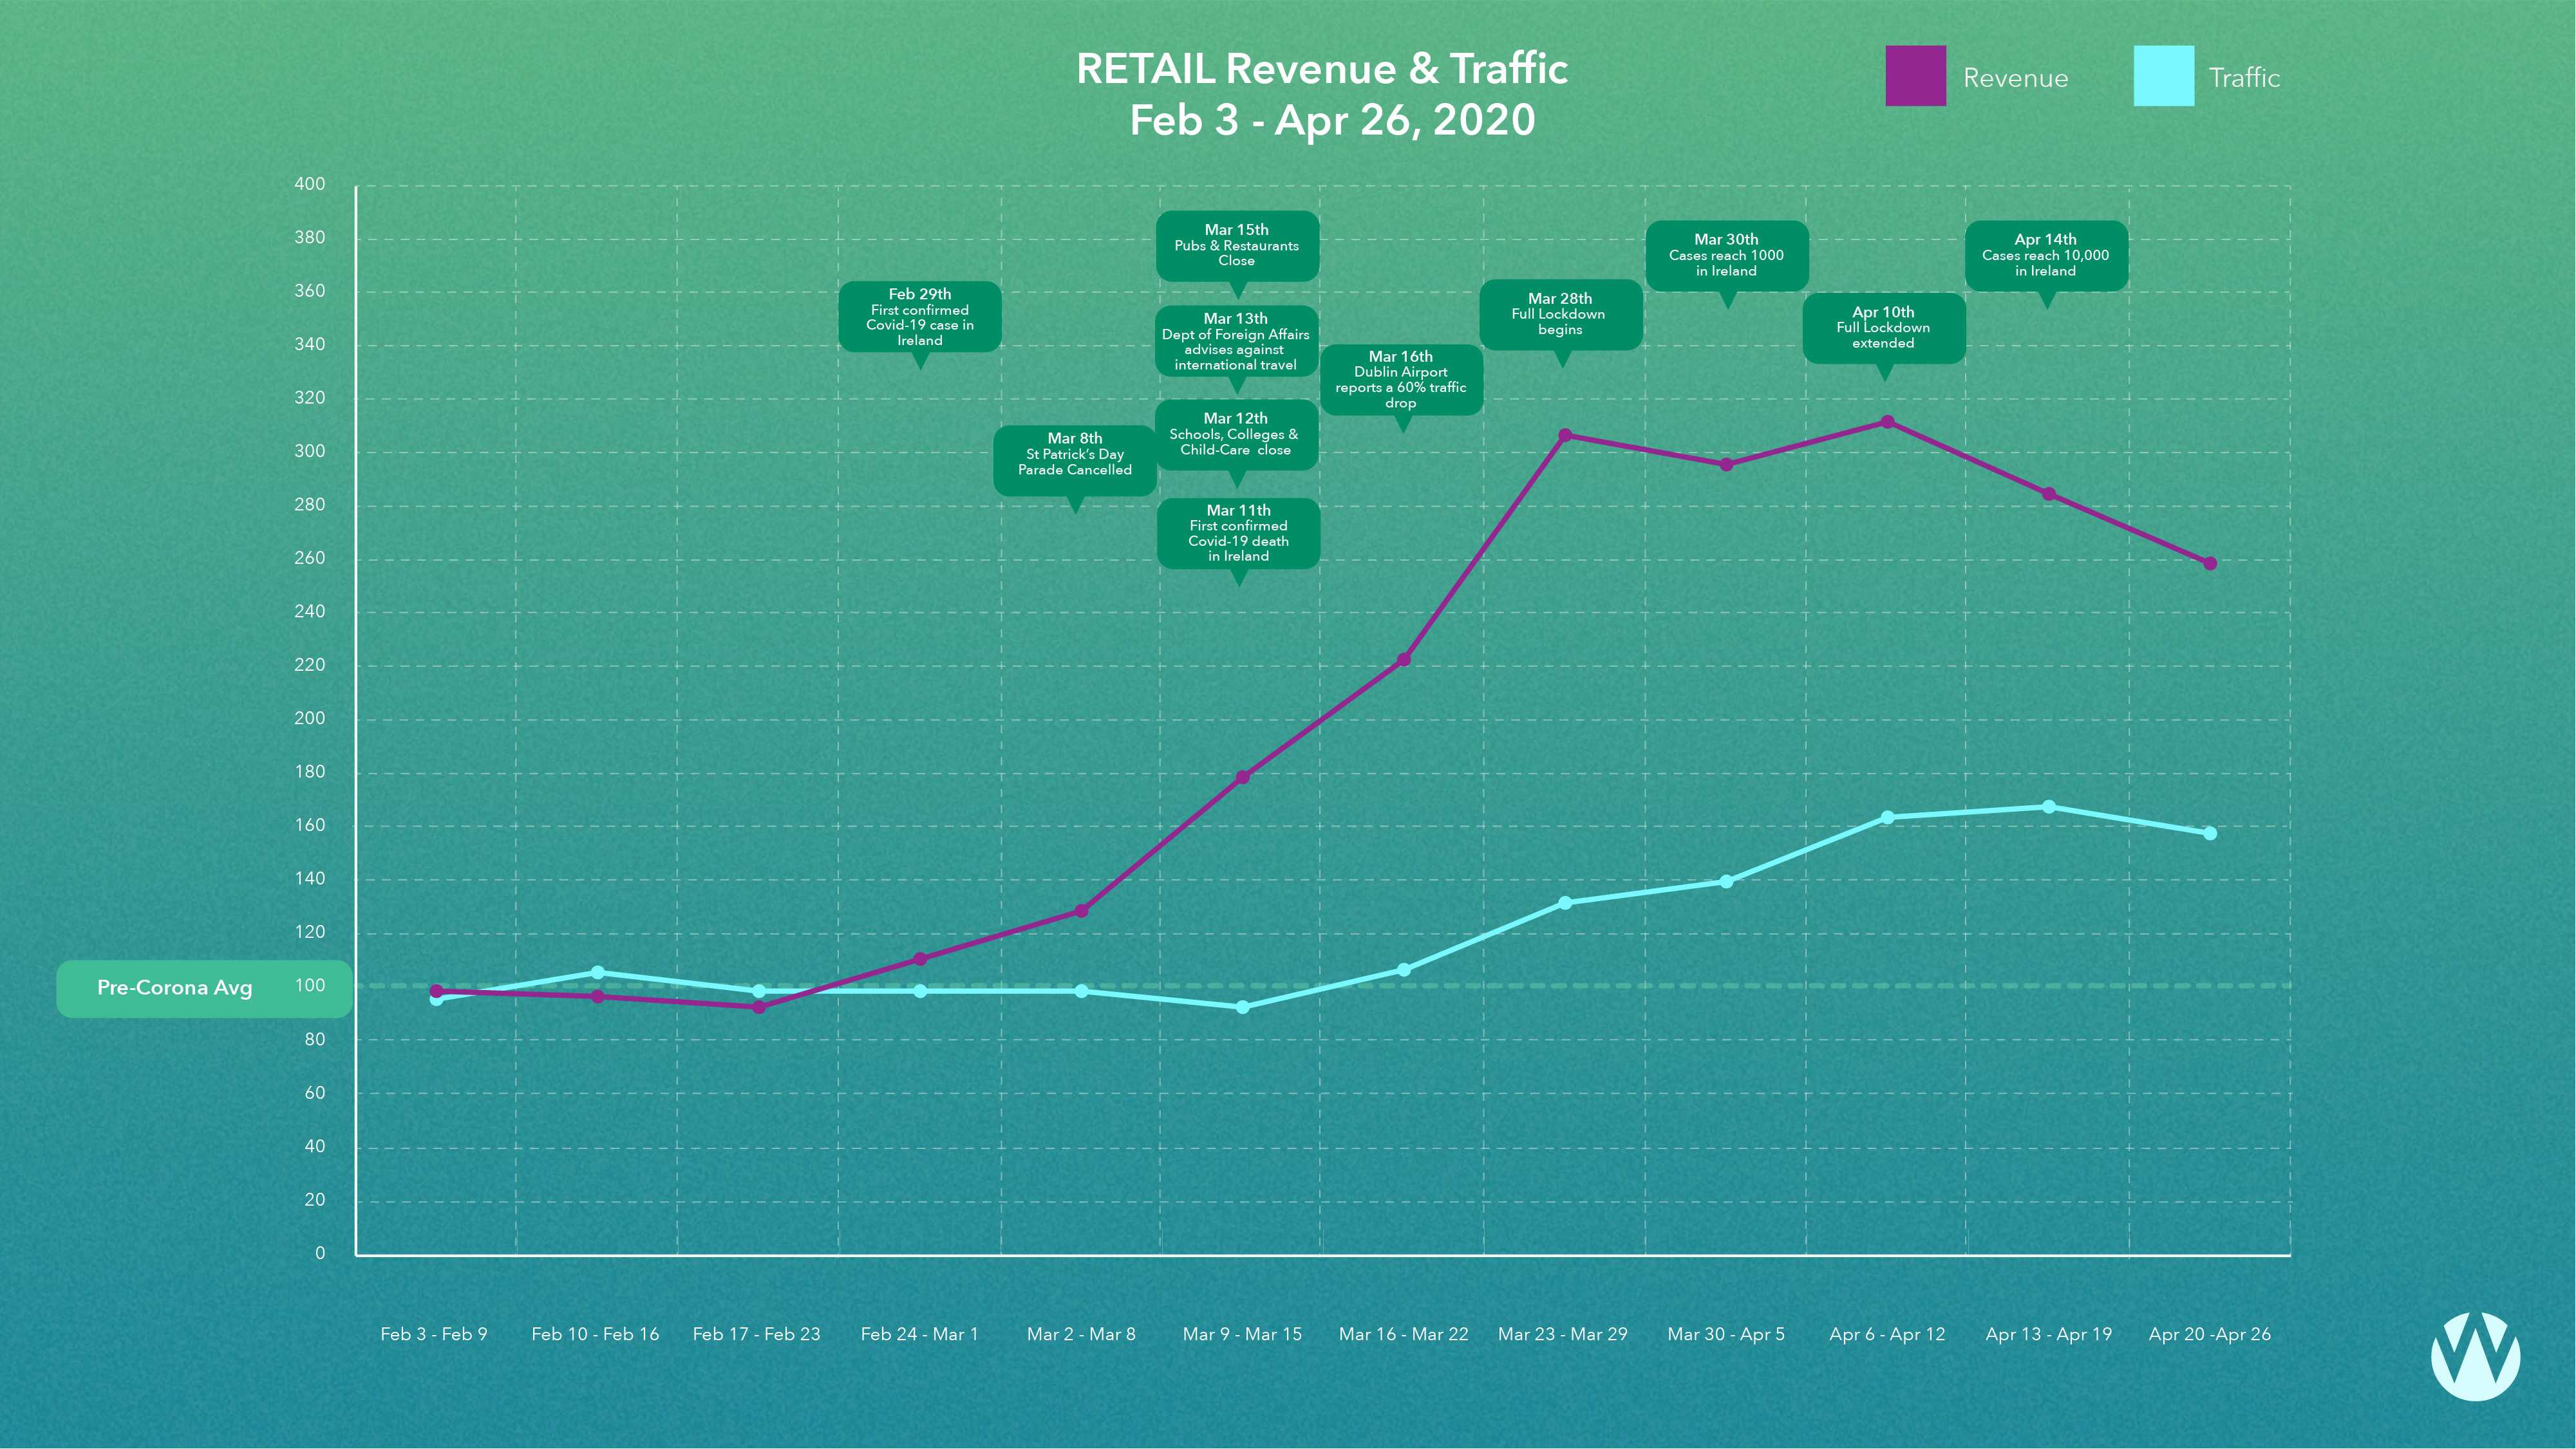
April week 4 saw a 58% increase in traffic on pre covid levels for online retailers.
Online revenues were up 159%.
How Does Covid 19 Online Demand compare to Christmas?
The Black Friday and Christmas seasonal splurge normally takes place over 4 weeks. We are now 8 weeks into heightened demand for online retail.
How high is that heightened demand compared with the usual November and December frenzy?
According to Google Trends, search demand to “buy online” is now treble that of Christmas 2019. Current levels of search demand are more than double anything we’ve seen during Black Friday or Christmas over the last five years.
The Enterprise Ireland COVID-19 Online Retail Scheme announcement brings welcomed news to the industry. The support covers up to a maximum of 80% of eligible costs on projects from €12,000 up to €50,000.
Find out about Wolfgang’s Covid-10 Online Retail Scheme Packages designed to help get your retail operations back on track, including details on how you can apply.
Applications open presently and close after 4 weeks.
Travel

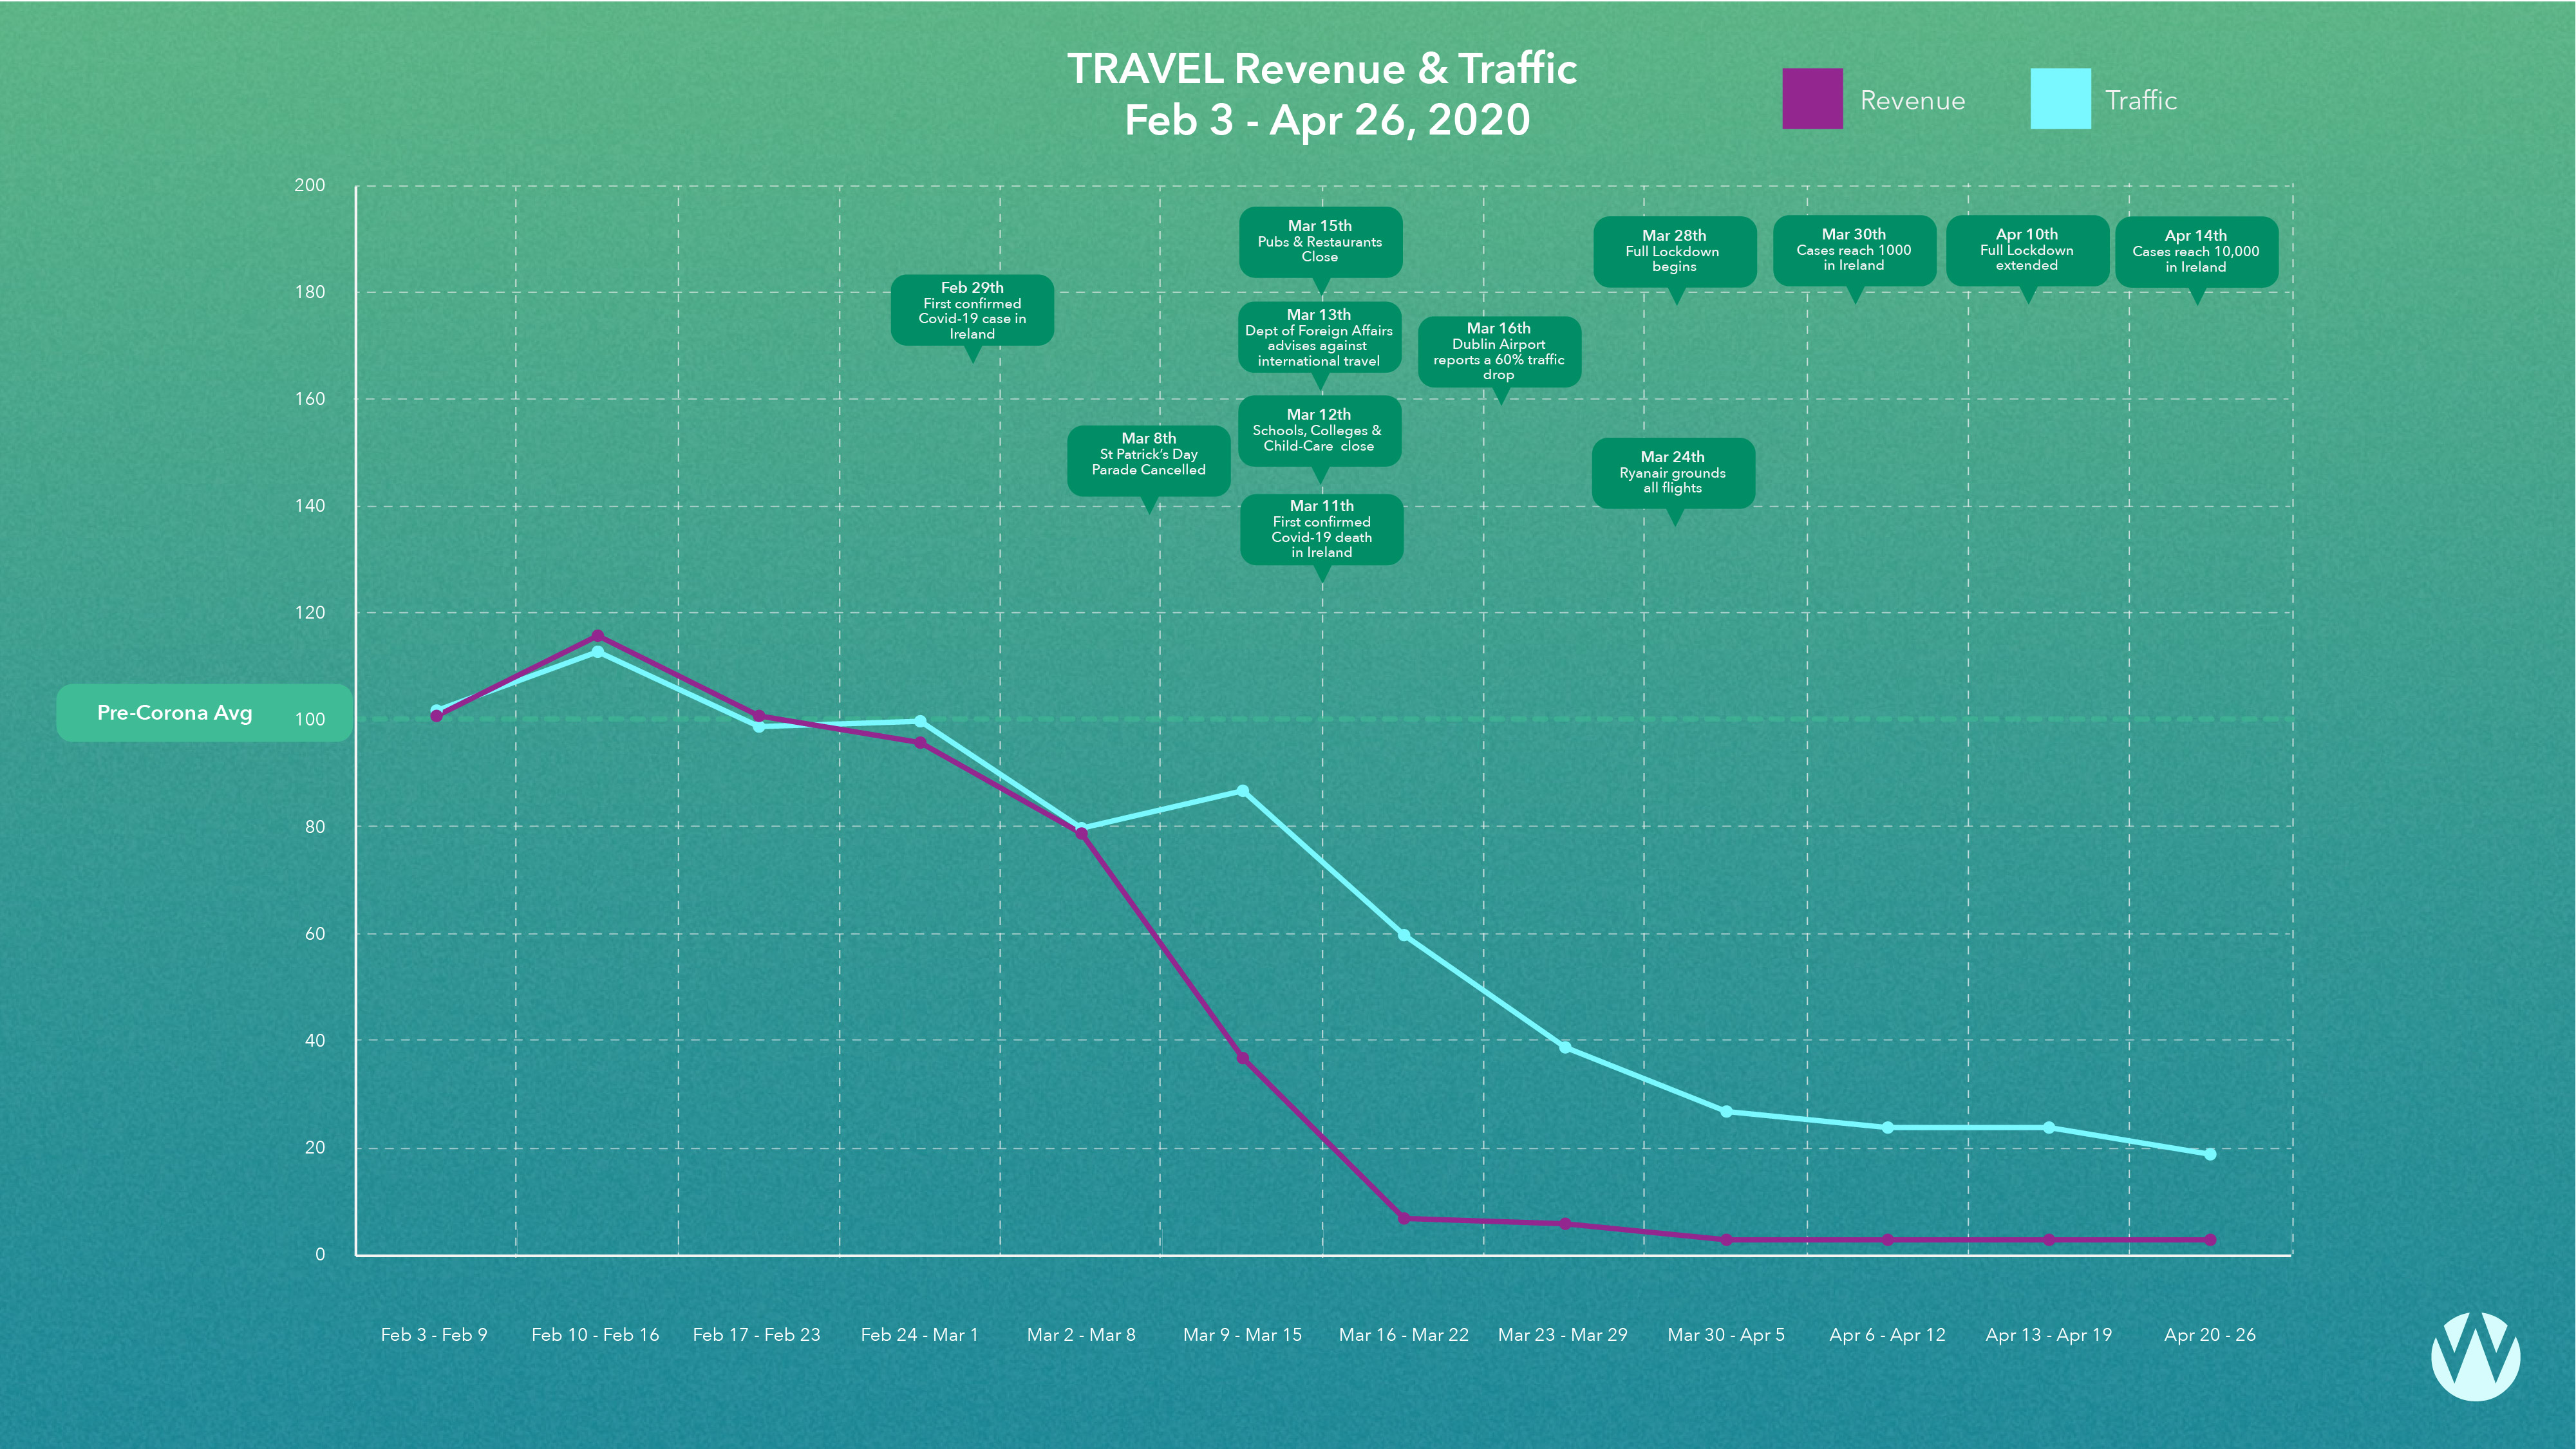
Last week’s traffic was down 81% on pre-covid levels.
Last week’s online revenue was down by 97% of the pre-covid weekly average.
We’ll have a deep dive for you on monthly trends next week and online traffic and revenue insights from inside Google and Amazon.
About the data
The dataset is dynamic, after we publish figures Google Analytics may continue to attribute revenue to previous weeks. In addition we might add and we might lose participants over time.This may lead to slight variances in the figures as time passes.


