By Emily Blackburn on 15 Jun 2018
-w600.jpg)
Have you ever felt overwhelmed in your day-to-day role? You know where you spend all your time putting out fires instead of concentrating on the bigger picture work. As a digital marketer, there's one massive area of work where this likely resonates: reporting. Working in a performance agency like Wolfgang Digital means we spend a large portion of our month providing our clients with the results from our work. Often, clients will require tailored metrics and KPIs which make sense to their own particular business.
The methodology can be cumbersome at times when it comes to reporting across various different businesses, whether it be running the same calculation over and over again or pulling different numbers from different areas of a Google Analytics accounts. In true infomercial style, I found myself asking: "there must be a better way".

There is a better way and it's called Supermetrics.
What is Supermetrics?
Supermetrics is an add-on for Google Sheets and Google Data Studio which allows you to pull reporting data from various third-party pieces of software such as Google Analytics, Google AdWords, MailChimp, Facebook and Moz - to name a few. You can set up reports to run on a schedule, set conditions for alerts, link up different accounts and basically make your whole reporting life much easier. I'd imagine you or one of your team dedicates a large portion of time to reporting. Here, I'm going to show you why you should spend some extra time on reporting innovation and automation. After all, less manual means improved accuracy and efficiency.
Today’s Digital Marketing Data
Wolfgang’s battle cry of late has been #Integration. It’s at our core as we bring together various digital marketing channels in order to achieve great results. A side effect of this is fragmented data. Great digital marketing now requires more channels, more measurement and more touch points than ever before which generates naturally generates more data in various locations.
As a result, a large portion of my month, and the majority of my monthly reporting time, is allocated to retrieving this data from various sources before providing quantitative findings in a final report.
The Problem With Quant
In Q4 2017, Wolfgang Digital conducted our first dedicated client survey. We carried feedback surveys in the past but they were often followed by Prosecco. I'm not sure how much you know about skewing figures, but Prosecco is an effective way to do it.
We considered our 2017 Q4 survey to be our first 'warts and all' source of feedback from our clients, as it was completely anonymous to ensure our baseline survey was honest. One of the questions that we asked as part of the survey was simply, “What do we need to get better at?”.
The feedback told us we needed to better at was reporting.
There was nothing technically wrong with our reporting, but there were two areas it wasn’t doing what we needed it to do. First of all, the feedback told us that our clients didn’t find our reports helpful. Secondly, as a business, we were dedicating a lot of time to the manual process of collating data from various sources.
It’s a double whammy. Not only were they time consuming, but reports weren't helping our clients in the way we thought they were.
The cause of this is actually rather simple.
Fragmented data + manual reporting processes = time consuming
Often, what seems like a simple data pull can take a considerable amount of time as you navigate your way through Google Analytics. With so much time spent on retrieving the data, there was little time left to explain what it all means. This is where Supermetrics comes in.
Using Supermetrics to Colour in the Gaps
As with many innovations, it began with a free trial. I got to grips with Supermetrics and started connecting it to the various accounts I use for reporting. It wasn't long before we shifted to premium as the impact of this centralised reporting tool was far beyond what we could have hoped for.
How Much Time I Saved With Supermetrics
For one of my own reports, I could reduce the amount of manual data retrieval while also using other Google Sheets plugins to take on tasks like automated translations. Some of the reports required me to repeat the same six calculations over and over again. We live in the era of machine learning and artificial intelligence, so I figured it was time to put the bots to work for me.
my reporting workflow reduced the manual element by an incredible 83%
Combined, the innovations I introduced to my reporting workflow reduced the manual element by an incredible 83%, both in generating report data, and performing quality checks on reports to account for any degree of human error
How I Spent This Newfound Time
This meant I had more time to "colour in" the data with helpful insights and provide my clients with qualitative information instead of quantitative data; just like they had asked for in their feedback. What I really love about this story is that it's built on two of Wolfgang's key pillars; Communication and Innovation with the latter leading to the former.
Supermetrics has also brought more innovation to our ways of working since. We now get automated messages should an account go down or experience a decline in performance, reducing inefficiencies and preventing problems before they begin to emerge. This is just the start of a Wolfgang Digital innovation passing an improved experience on to our clients, but we've freed up the most important thing we need to do so; time.
The Wolfgang Essential Takeaway
Whether you are in an agency or an in-house team, watch out for repetitive manual tasks that can be automated. Is that weekly report you do being helpful and providing insight, or is it just taking up your valuable time and taking you from where you can really offer your business value?
We're all time poor and the logical step of spending four hours on an automation task today in order to save eight hours over the next month can be tough, but just remember that all this time can be better spent.
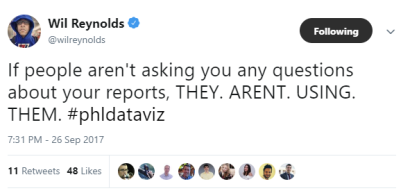
Finally, here's a protip from Wil Reynolds if you're not sure how useful and helpful your reports are:


